Trend strategy guide
EMA Cloud Trading Strategy Explained: Trend, Pullbacks, Breakouts, and Risk
An EMA cloud turns two or more exponential moving averages into a visual trend regime. The attraction is obvious: instead of reading several lines independently, traders can see whether faster averages are above or below slower averages and whether the gap between them is expanding or compressing. The cloud can be useful for trend context, pullbacks, and breakout filtering, but it should not be confused with a complete strategy unless entry, invalidation, volatility, and market-structure rules are defined as well.
Quick answer
Quick answer to EMA cloud trading strategy
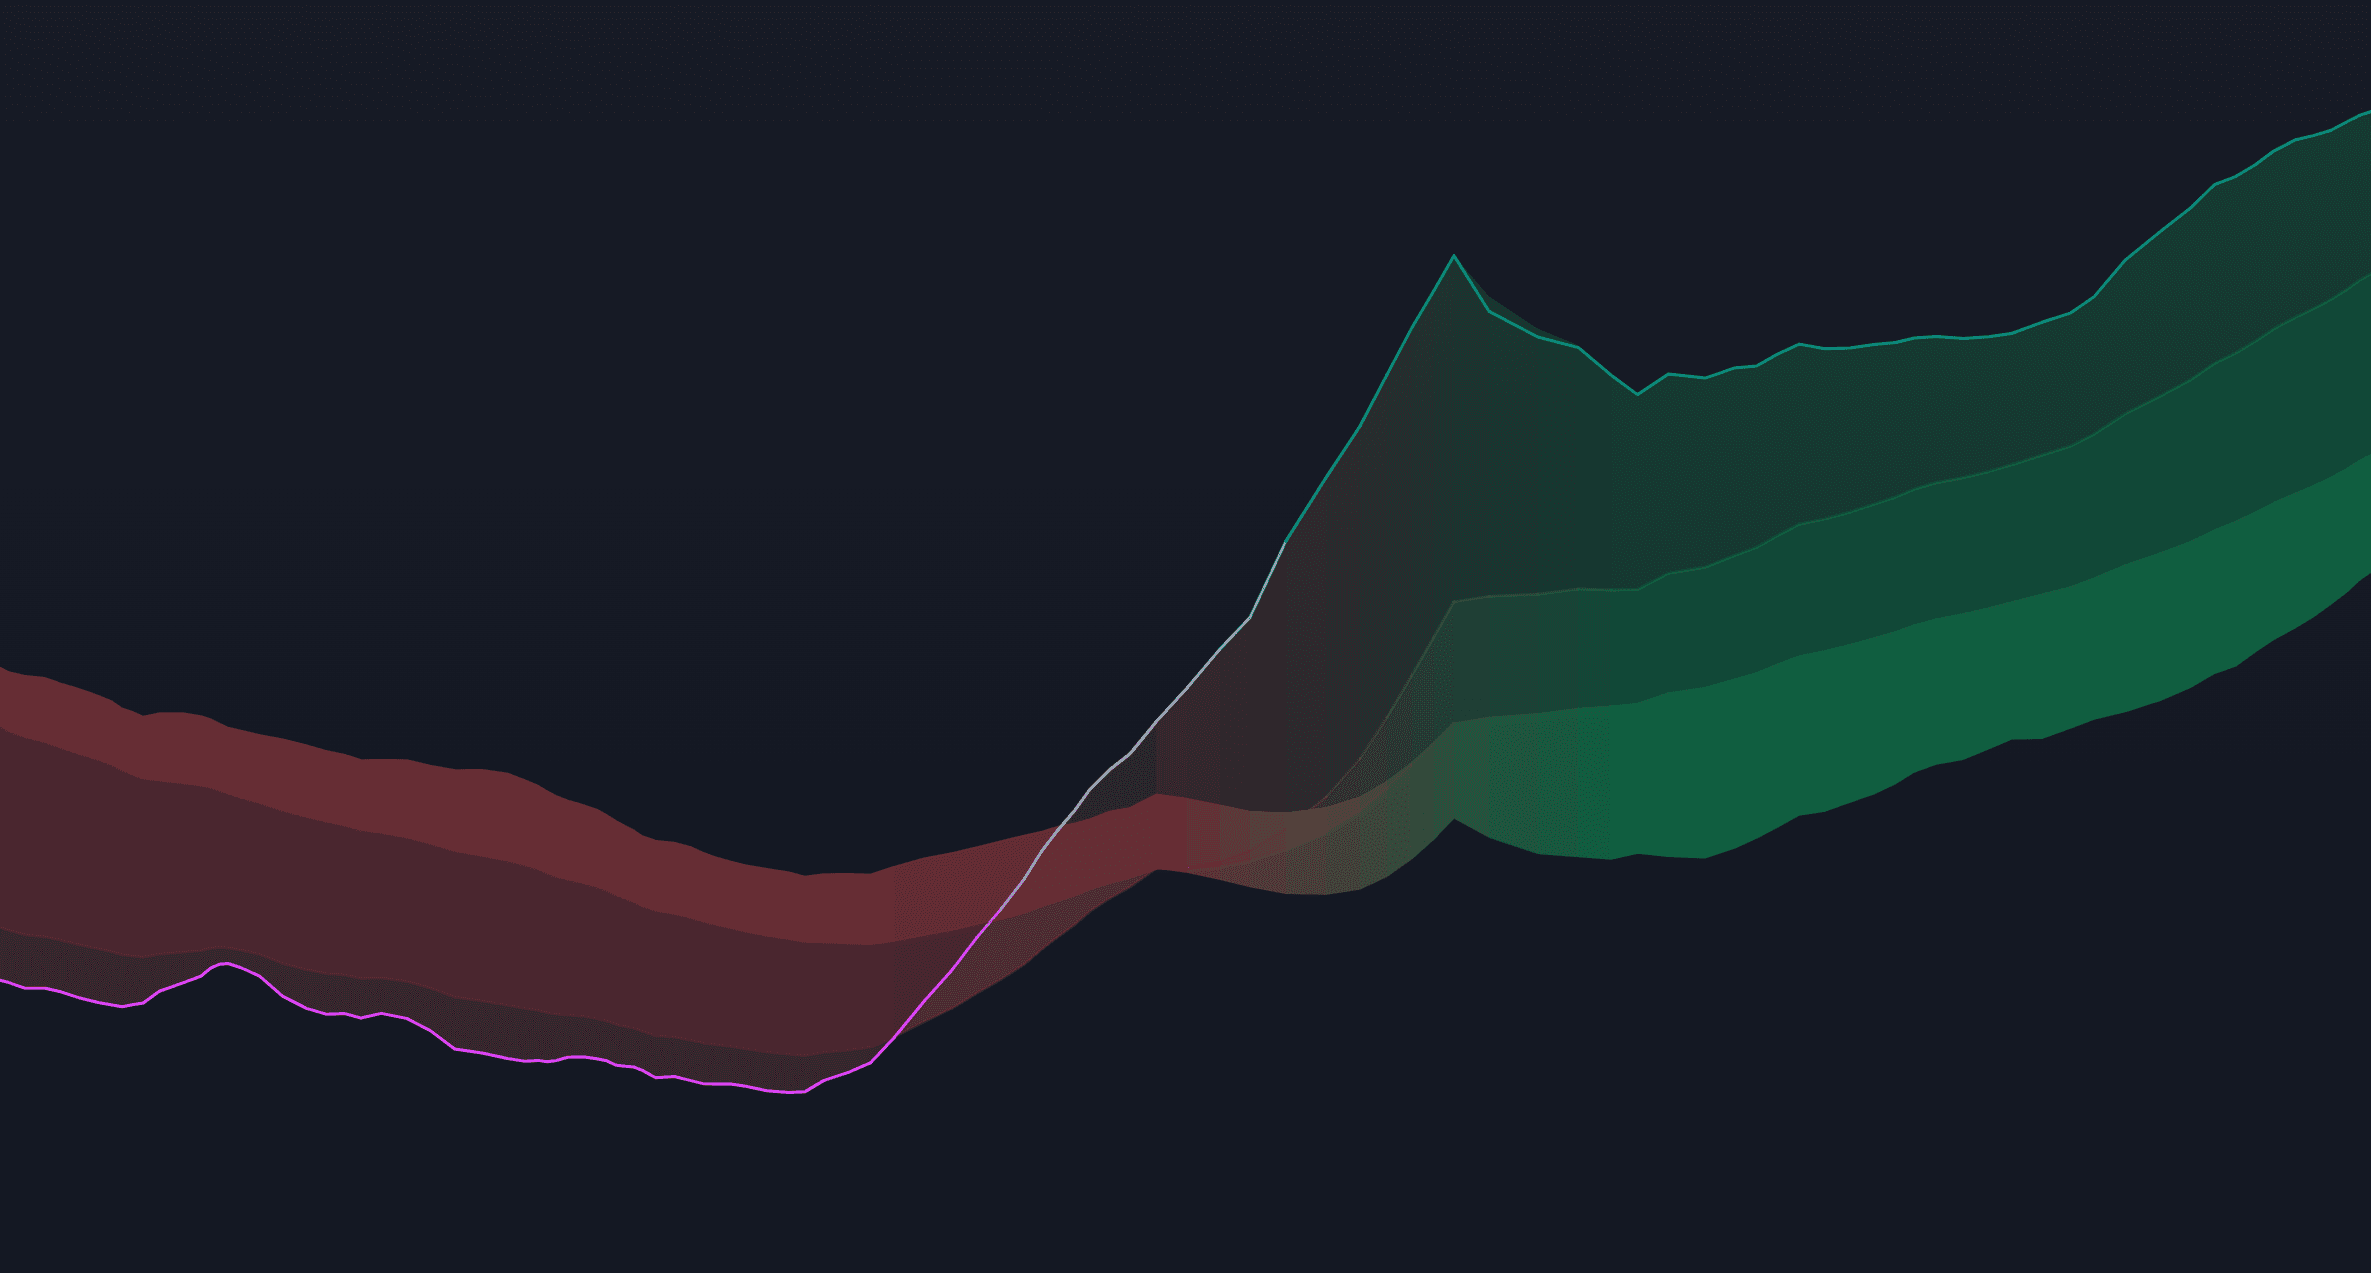
An EMA cloud uses two or more exponential moving averages to visualize trend regime, relative momentum, and dynamic areas of reaction. It is a lagging price-based framework, so it is most useful as context rather than as proof that a breakout will continue.
Key takeaways
- EMA clouds weight recent prices more heavily than simple moving averages but still lag price.
- Cloud slope, separation, and price location can organize trend context without predicting the future.
- Combine a cloud with separately defined structure and risk rules instead of treating a crossover as a complete trade plan.
What an EMA cloud actually measures
An exponential moving average gives more weight to recent prices than a simple moving average. When a fast EMA is plotted against a slower EMA, the relationship between them becomes a basic trend filter. If the fast average is above the slow one, the short-term path of price is stronger than the longer-term path. If it is below, the opposite is true. Filling the area between the averages creates a cloud that makes this relationship easier to read at a glance.
The cloud is still derived from price, so it is inherently lagging. That is not necessarily a weakness. A trend filter is not supposed to predict the next candle; it is supposed to classify the environment consistently. The useful question is whether the lag is acceptable for your timeframe and whether the cloud helps you avoid taking breakout trades against the broader direction. Traders should test the same EMA lengths across several market regimes before concluding that a particular combination is superior.
Four common ways traders use an EMA cloud
The first use is simple regime filtering. Traders only consider bullish setups while the fast EMA remains above the slow EMA and bearish setups while the relationship is reversed. The second use is pullback context: price retraces toward the cloud during an established trend, and the trader watches for evidence that the pullback is ending. The third use is breakout confirmation, where a structure break is preferred when the cloud already supports the direction. The fourth use is trend transition, when the cloud flips and begins expanding in the opposite direction.
Each use requires different expectations. A pullback setup may enter close to the cloud and use recent structure for invalidation. A breakout setup may occur far from the cloud after a range expansion. A cloud flip may be too late for a fast move but useful as confirmation that the prior trend has weakened. Treating every cloud interaction as the same signal usually produces inconsistent results because the market context is different.
- Trend regime: trade only in the direction of the cloud
- Pullback context: watch reactions near the cloud during established trends
- Breakout filter: prefer structure breaks aligned with the cloud
- Transition signal: monitor cloud flips and expansion after regime changes
Using an EMA cloud inside a breakout workflow
A cloud becomes most useful when it is one part of a broader structure-first process. Start by marking support, resistance, a consolidation boundary, or another predefined level. Then use the cloud to describe the prevailing direction before price reaches that level. If a bullish breakout occurs while the cloud is bullish and expanding, the setup has trend alignment. If the same breakout occurs while the cloud is bearish, the move is countertrend and should be evaluated with different expectations.
Alignment does not guarantee continuation. A breakout can fail even when every moving average points in the same direction. That is why traders often add an independent confirmation such as relative volume, volatility expansion, a candle-close rule, or higher-timeframe structure. The purpose is not to collect as many confirmations as possible. It is to ask separate questions: where is the level, what is the trend, is participation present, is volatility expanding, and where does the idea fail?
Choosing EMA lengths without over-optimizing
Common EMA combinations include short pairs such as 9 and 21, medium pairs such as 20 and 50, and longer trend filters such as 50 and 200. Those numbers are popular because many traders watch them, not because they possess universal predictive power. Faster pairs react quickly but flip more often in ranges. Slower pairs reduce noise but respond later to new trends. The right balance depends on the market, timeframe, and how much lag your entry process can tolerate.
The biggest risk is optimizing lengths until a historical chart looks perfect. A pair that appears ideal on one instrument can fail on another or deteriorate when volatility changes. A stronger testing process selects a small number of plausible settings, keeps them fixed, and evaluates them over multiple periods. Record the number of regime flips, the amount of whipsaw, the average distance from price to the cloud at entry, and whether the filter actually removes low-quality trades from your specific strategy.
Changing EMA lengths after every losing sequence prevents meaningful evaluation. Keep settings stable long enough to observe different trend and range conditions.
Where EMA clouds fail
EMA clouds struggle most in sideways conditions. Price can cross back and forth, the averages flatten, and the cloud changes direction repeatedly. That is not a calculation error; it reflects the absence of a stable directional regime. A trader who treats every cloud flip as a trade signal may experience repeated whipsaws. Structure and volatility filters can help identify these conditions, but no filter can remove them entirely.
The second limitation is late confirmation after sharp reversals. Because the averages require price history, a fast reversal can travel a meaningful distance before the cloud changes direction. The third limitation is correlation. Adding several moving averages, MACD, and other price-derived trend tools may look like multiple confirmations while measuring similar information. For a cleaner process, combine a cloud with inputs that answer different questions, such as structure, participation, and volatility.
EMA clouds versus the B:PRO adaptive Cloud
B:PRO includes a four-line adaptive Cloud that is part of its broader trend and breakout framework. It should not automatically be described as a standard EMA cloud because the product documentation defines it as its own dynamic structure. The practical similarity is visual: both approaches help the trader classify trend context and reaction areas. The important difference is that B:PRO combines its Cloud with structure, configurable filters, Safety and Quality ratings, event markers, alerts, and Future Targets.
For traders comparing the two approaches, the question is not which cloud is universally better. A basic EMA cloud is transparent, easy to reproduce, and useful for traders who prefer modular charts. B:PRO is designed for traders who want more of the decision workflow integrated. In either case, the cloud should remain one layer of evidence. Entries, invalidation, position size, and risk still require explicit rules outside the visual trend regime.
A practical EMA cloud testing plan
Choose one market and timeframe, one EMA pair, and one entry concept such as a structure breakout aligned with the cloud. Define exactly when the cloud is considered bullish, bearish, or neutral. Decide whether a trade requires a candle close beyond structure and whether the cloud must already be aligned before the breakout candle begins. Then define invalidation and risk. Those details matter more than whether the cloud looks visually smooth.
Test trending, ranging, high-volatility, and low-volatility periods. Separate trades that the cloud allowed from trades it filtered out. Review whether filtered trades were genuinely lower quality or whether the cloud simply entered too late. A useful filter should improve consistency, not just reduce the sample size. Forward testing and Bar Replay are especially valuable because they show how the cloud changed in real time rather than only how it looks on a completed historical chart.
Frequently asked questions
What are the best EMA settings for a cloud strategy?
There is no universal best pair. Faster EMAs react sooner and create more regime changes; slower EMAs reduce noise but add lag. Choose a small number of plausible settings and test them on the market and timeframe you actually trade.
Can an EMA cloud be used for breakout trading?
Yes. Many traders use the cloud as a trend filter and only consider structure breakouts aligned with the cloud. Structure, participation, volatility, and invalidation still need their own rules.
Is the B:PRO Cloud an EMA cloud?
B:PRO documentation describes its Cloud as a dynamic four-line trend structure. It should not be assumed to be a standard EMA cloud unless the product documentation explicitly says so.
Do EMA clouds repaint?
A standard EMA recalculates as the live candle changes because the current close is not final. Historical closed-bar EMA values should remain based on the data available for those bars. Traders should distinguish normal live-candle updates from historical signal repainting.
Sources & further reading
Primary references
References support platform mechanics, market structure definitions, or product documentation. They do not imply performance guarantees or endorsements.
Continue your research