TradingView comparison guide
Best Breakout Indicators for TradingView in 2026: What to Compare Before You Choose
The best breakout indicator is not the one with the most arrows. It is the one that makes a breakout easier to define, verify, invalidate, and review without hiding the trade-offs. This guide compares the main breakout-indicator categories available to TradingView users in 2026 and explains where an integrated framework such as B:PRO fits among simpler structure, volume, volatility, and trend tools.
Quick answer
Quick answer to best breakout indicators TradingView
There is no single best breakout indicator for every trader. A useful comparison separates six jobs: defining structure, measuring participation, normalizing volatility, identifying trend context, verifying signal integrity, and turning those inputs into a repeatable alert and review workflow.
Key takeaways
- Compare indicators by the job they perform, not by the number of signals they produce.
- Structure, volume, ATR, trend context, and signal integrity answer different questions and should not be treated as interchangeable confirmation.
- A breakout tool should be reproducible in real time or Bar Replay and should make invalidation understandable before entry.
What “best” should mean for a breakout indicator
Search results often treat breakout indicators as if they can be ranked by a single number. In practice, different tools solve different parts of the problem. A Donchian-style channel can define a price extreme cleanly. Volume can show whether participation expanded. ATR can describe volatility and help normalize distance. A trend cloud can show regime. None of those functions automatically proves that a breakout is tradable, and combining them only helps when each input has a clear job.
A productive comparison therefore begins with workflow rather than marketing. Ask whether the tool defines the level before price crosses it, whether the signal can be reproduced in Bar Replay, whether confirmed signals remain stable, whether alerts carry useful context, and whether invalidation can be planned before entry. A visually impressive chart is less important than a process you can repeat across symbols and timeframes without changing the rules after every loss.
- Clear structure before the breakout occurs
- Independent confirmation rather than duplicated indicators
- Transparent live-candle and confirmed-bar behavior
- Alerts that identify a review point instead of forcing a trade
- A practical way to define invalidation and next resistance or support
- Settings that can be documented and forward-tested consistently
Six breakout-indicator categories worth comparing
The first category is pure structure: channels, swing highs and lows, support and resistance zones, opening ranges, or consolidation boundaries. These tools answer where price is breaking from. The second category is participation: volume, OBV, relative volume, or market-specific order-flow proxies. They answer whether activity increased as the level was challenged. The third category is volatility: ATR, Bollinger Bands, Keltner Channels, or range expansion. These tools help distinguish a genuine expansion from a tiny move beyond the level.
The fourth category is trend context, including moving-average stacks, EMA clouds, higher-timeframe bias, or adaptive trend regimes. The fifth is signal-integrity tooling: confirmed-bar logic, non-repainting event markers, and transparent higher-timeframe handling. The sixth is workflow integration: one interface that combines structure, confirmation, scoring, alerts, targets, and visual context. Integrated tools reduce chart clutter, but they should still make each component understandable instead of hiding everything behind a single score.
A practical comparison framework for TradingView users
When you test two breakout indicators, use the same market, timeframe, date range, and execution rules. Mark the breakout level before the event, record whether the signal appeared intrabar or only after close, and note what changed after refreshing the chart. Then track the distance to invalidation, the next opposing level, and whether the signal occurred with or against the higher-timeframe regime. This removes much of the hindsight advantage that can make every historical indicator look better than it behaved live.
Do not compare tools only by win rate. A tool that produces fewer but clearer setups may suit a discretionary trader better than one that produces hundreds of marginal alerts. Useful evaluation metrics include signal frequency, average distance to invalidation, percentage of alerts you can realistically review, stability of confirmed signals, and the amount of manual interpretation still required. The objective is not to find a perfect indicator. It is to find a framework whose behavior you can understand and test.
No indicator can guarantee a successful breakout. Historical chart quality and backtest appearance are not substitutes for real-time observation, Bar Replay, and forward testing.
Simple tools versus integrated breakout systems
A simple breakout channel has a major advantage: you know exactly what it measures. That transparency makes it easy to test. The disadvantage is that you must build the rest of the process yourself. You may need a separate trend filter, volume study, ATR panel, higher-timeframe chart, alert logic, and target framework. For experienced traders that modular approach can be ideal because every component remains independently controllable.
Integrated systems trade some modularity for speed and consistency. B:PRO, for example, is designed to place trend context, support and resistance structure, configurable filters, Safety and Quality ratings, alerts, and future target guidance in one TradingView workflow. That does not make it automatically better than a simple channel. Its value depends on whether you prefer a unified decision framework and whether you understand what each layer contributes before relying on the combined output.
Where B:PRO fits in the breakout-indicator landscape
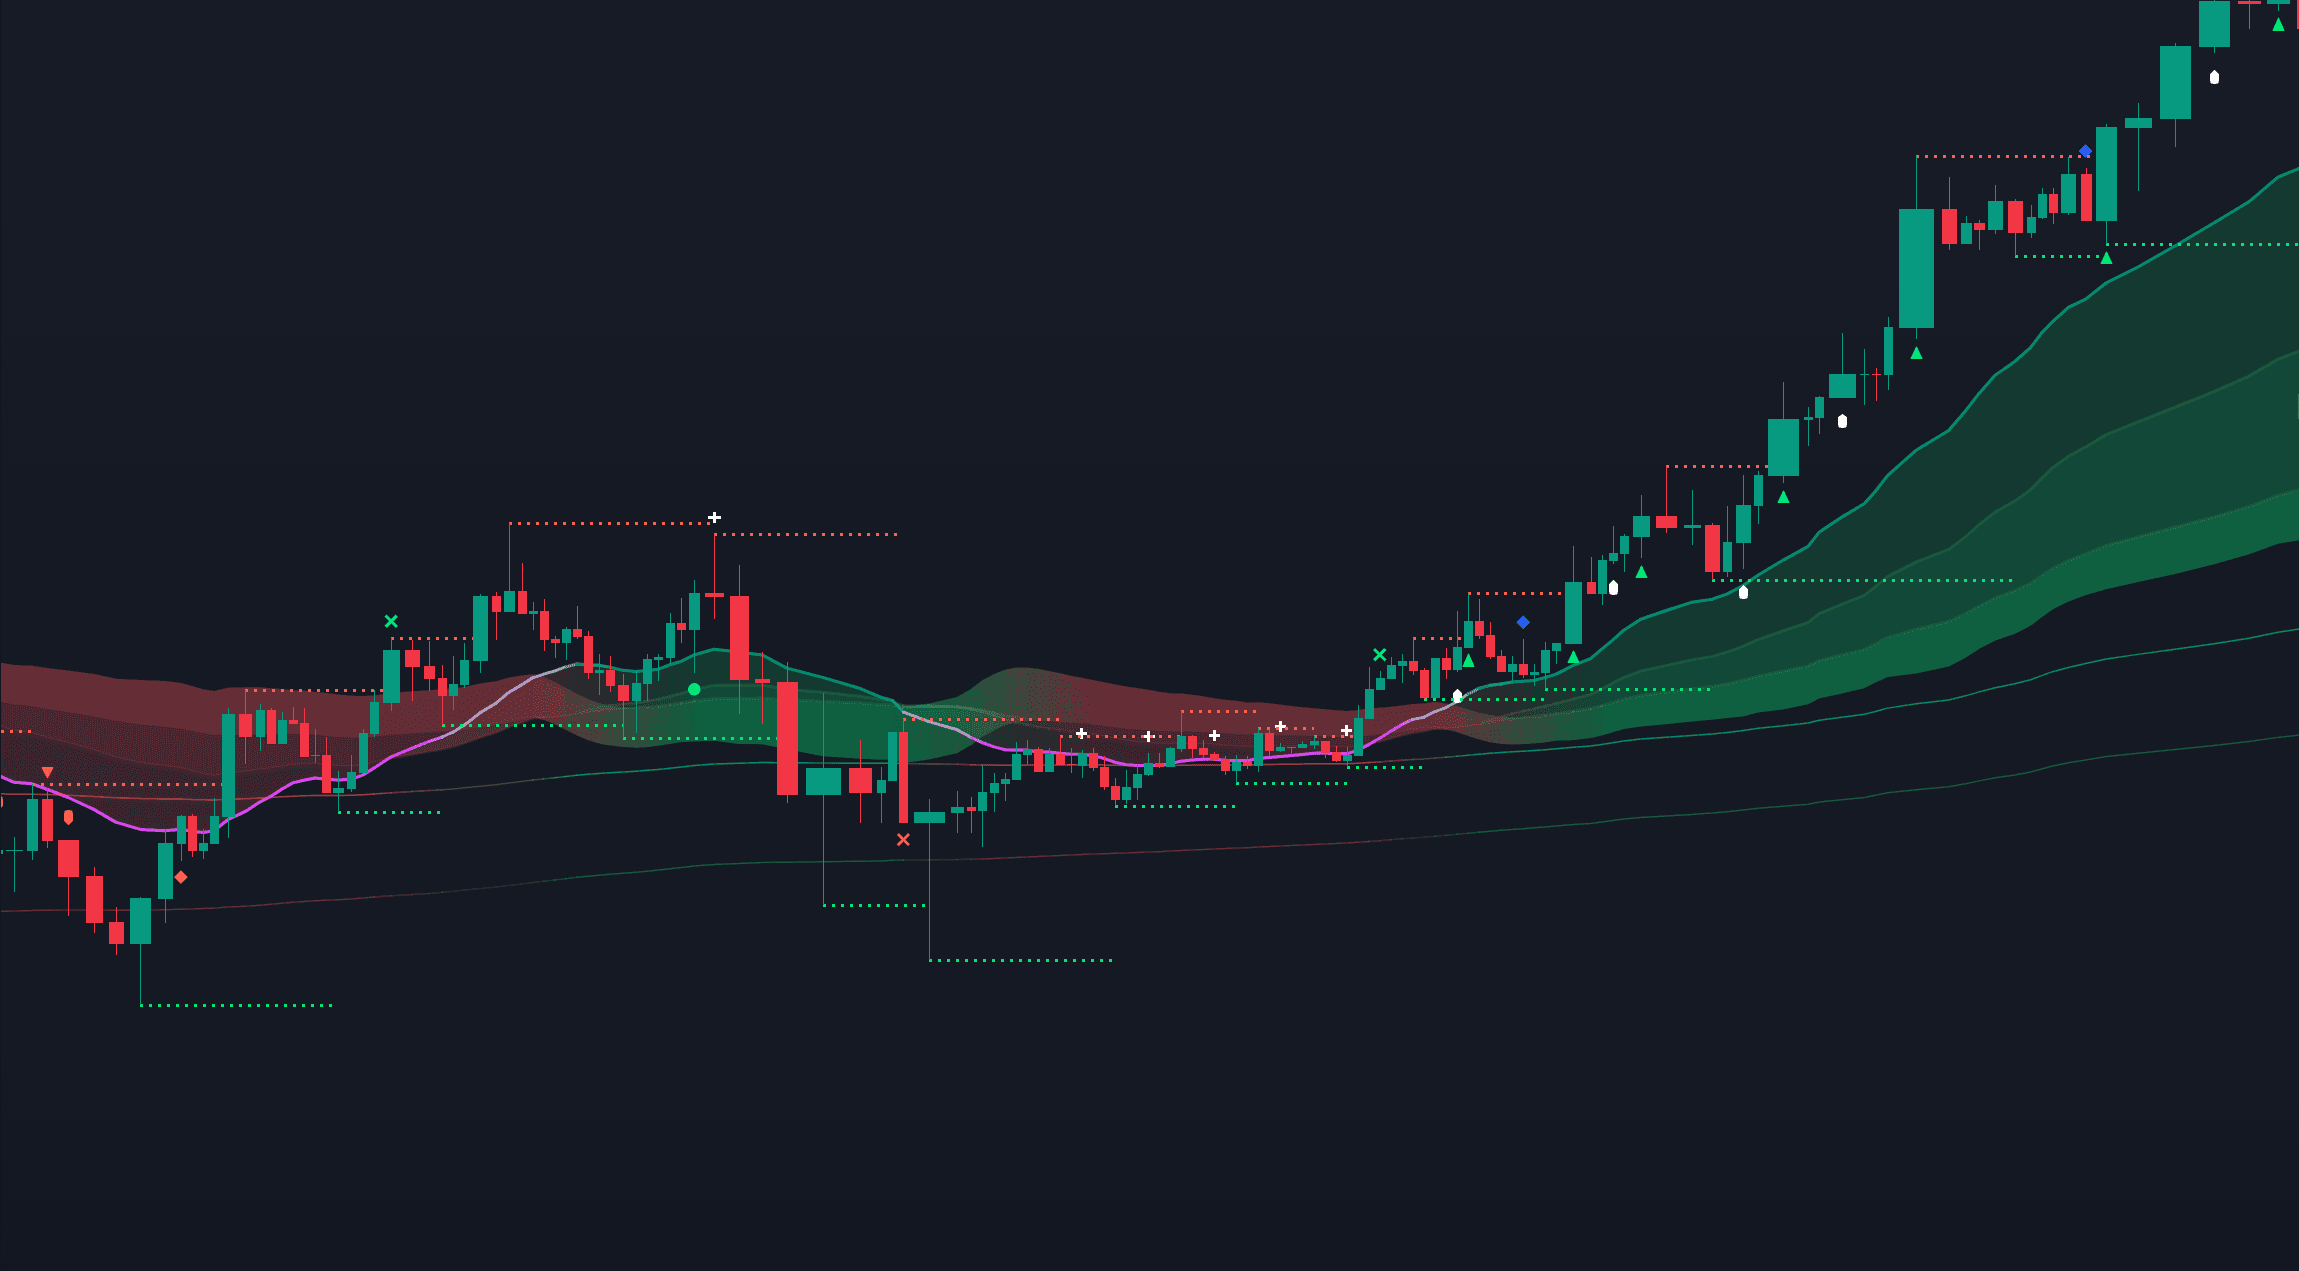
B:PRO is best understood as a discretionary breakout-and-trend framework rather than a single trigger. The documented workflow combines an adaptive Cloud, multiple trend lines, swing structure, support and resistance zones, selectable confirmation filters, Safety and Quality ratings, event markers, alerts, and Future Targets. The goal is to organize several independent questions on one chart: What is the regime? Where is structure? Is the move confirmed? What would invalidate the idea? Where could the next reaction occur?
The important limitation is the same as with every multi-factor system: more information can become false confidence if the trader treats a score as a probability. B:PRO ratings are not win probabilities, and a high-rated setup can fail. The practical way to evaluate the product is to keep settings stable, observe signals in real time or Bar Replay, document which market regimes produce useful setups, and compare the complete workflow with the simpler alternative you would otherwise use.
Checklist before choosing a breakout indicator
Before paying for any TradingView indicator, verify the basics. Read the documentation. Check whether the script is invite-only or open source, what data it uses, how alerts are created, and whether live-candle behavior is explained. If a seller uses terms such as non-repainting, AI, institutional, or high accuracy, look for precise definitions rather than accepting the label. A responsible product should make it possible to understand what can change and what remains fixed after confirmation.
Then test the workflow with the markets you actually trade. A crypto trader needs 24/7 behavior and should expect weekend liquidity differences. A forex trader needs to understand that spot volume is usually broker tick volume rather than centralized exchange volume. A futures trader should separate regular trading hours from overnight Globex conditions. A breakout indicator that performs cleanly on one market can behave very differently on another because the underlying microstructure is different.
- Can you explain the signal in plain language?
- Can you reproduce it in Bar Replay?
- Do confirmed historical signals remain where they originally formed?
- Can alerts be limited to events you actually review?
- Can you identify invalidation before taking the trade?
- Can you test the same configuration for several weeks without constantly retuning it?
A 30-day evaluation plan
Use one or two markets and one primary timeframe for the first month. Save the exact indicator settings and do not optimize them after each outcome. For every signal, record the market regime, the structure being broken, whether the candle closed beyond the level, the state of volume or volatility, the planned invalidation, and whether you acted on the setup. Screenshots before and after the event are more useful than screenshots taken only after a successful move.
At the end of the period, review the quality of the process rather than searching for a perfect win rate. How many alerts were actionable? How often did the tool highlight a move you would have missed? Did it reduce or increase chart clutter? Were losing setups understandable in hindsight without changing the rules? If the framework makes decisions more consistent and easier to audit, it is doing useful work even though it cannot remove market risk.
Frequently asked questions
What is the best breakout indicator on TradingView?
There is no universal best indicator. Structure channels, volume tools, ATR or volatility studies, trend clouds, and integrated systems solve different parts of the breakout problem. The best choice is the one whose rules you can understand, reproduce, and forward-test on your own markets.
Is B:PRO better than a Donchian Channel or simple resistance line?
They serve different purposes. A Donchian Channel or manually marked level is simpler and highly transparent. B:PRO combines structure with trend context, filters, ratings, alerts, and targets. Whether the integrated workflow is more useful depends on the trader and should be tested rather than assumed.
Do non-repainting breakout indicators guarantee better results?
No. Non-repainting describes signal behavior, not profitability. A stable historical signal can still be based on a weak trading idea or fail in live market conditions.
Should I use volume and ATR with a breakout indicator?
They can add useful independent context. Volume helps assess participation, while ATR helps normalize volatility and distance. They should support a predefined rule set rather than be added after the fact to justify a trade.
Sources & further reading
Primary references
References support platform mechanics, market structure definitions, or product documentation. They do not imply performance guarantees or endorsements.
Continue your research